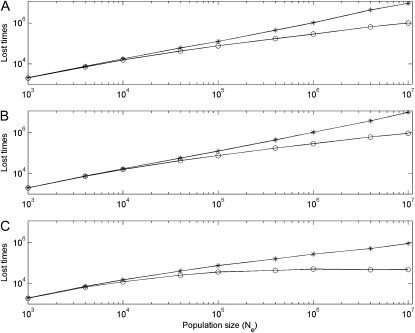
Figure 7.—
Simulation results of the lost times of the CHDL in haploid vs. diploid populations with μ = 10−5 before it is successfully fixed in the population. Asterisks and circles are simulation results for linked and unlinked gene duplication, respectively. Simulation results in subplot A are obtained under the DNR selective model in haploid populations with population sizes 2N; in subplot B simulation results are obtained in diploid populations under the DNR selective model with population sizes N; in subplot C results are obtained in diploid populations under the HI selective model with population sizes N. Simulation repeats 2000 times.

