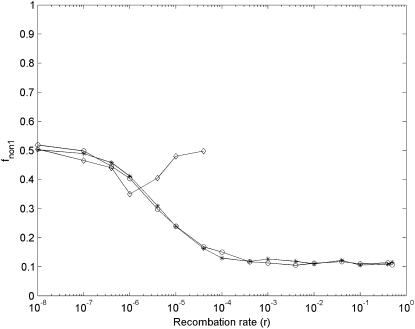
Figure 9.—
Simulation results of the proportion of nonfunctionalization finally occurring at the ancestor locus (fnon1) after segmental gene duplication in haploid vs. diploid populations as a function of recombination rates with μ = 10−5. Asterisks, circles, and diamonds are simulation results under the DNR selective model in a haploid population (N = 800000), under the DNR selective population in a diploid population (N = 400000), and under the HI selective model in a diploid population (N = 400000), respectively. When r > 4 × 10⁻⁵, under the HI selective model, nonfunctionalization for unlinked gene duplication is difficult to reach because of much prolonged time to nonfunctionalization. Simulation repeats 2000 times.

