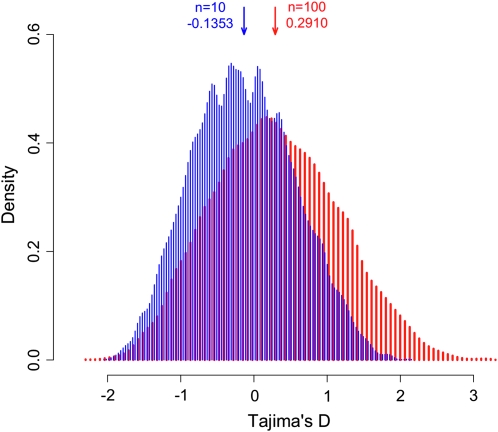
Figure 1.—
Frequency distribution of Tajima's D for n = 10 (blue) and n = 100 (red) for a frequency spectrum with an excess of alleles between 0.1 and 0.2. The distributions were obtained from simulations of an admixture of two populations (one single population split in two isolated at 0.2Ne generations from present, with Ne1 = 0.15Ne and Ne2 = 0.85Ne, and merged 8Ne generations later). A short period of high recombination values was used at the beginning (first 0.2Ne generations) to reduce the effect of discrete sampling from one or the other population, especially in the case of n = 10.

