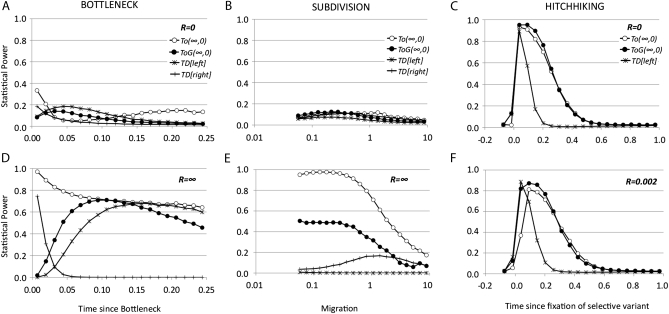
Figure 3.—
Statistical power of TO tests and Tajima's D test for a sample n = 20 and θ = 0.05 per nucleotide in a region of 1000 nucleotides for a given alternative model (expansion, subdivision, or hitchhiking) and for different values of recombination R = 4Ner. The null (stationary) model and the alternative model were compared using the same recombination rate. Open circles represent TO(∞,0) left tail, solid circles represent TOG(∞,0) left tail, stars represent Tajima's D left tail, and +'s represent Tajima's D right tail. Type I error was set to 0.025 for each tail. (A and D) Bottleneck model: the x-axis shows the time (measured in 4Ne generations) since a stationary population suddenly dropped 0.1 × Ne times and recovered 0.05 × 4Ne generations later (from present to past); recombination R = 0 (A) and R = ∞ (D). TOG is based on a uniform distribution over a range of time since bottleneck between 0.001 and 0.25 × 4Ne generations. (B and E) Subdivision model: the x-axis shows different values of migration (M = 4Nem) between two populations of equal size. TOG is based on a log-uniform distribution over a range of migration values (4Nem) between 0.05 and 10; recombination R = 0 (B) and R = ∞ (E). (C and F) Hitchhiking model: a region located 40 kb left of the studied region experienced a selective event with a fitness value s = 2 × 10⁴ in a population of Ne = 1 × 10⁶. The x-axis shows the time since the selective variant was fixed in the population, ranging from −0.1 (still not fixed) to 1.0 in 4Ne generations. The same range was used for TOG with uniform distribution. Recombination R = 0 (C) and R = 0.002 per nucleotide (F).

