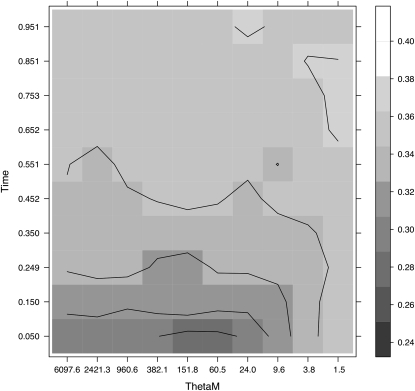
Figure 6.—
Plot showing the P-value of the test TO0,0 for a grid of two parameter values (TM, the time since the migration started in the y-axis, and θM = MHA, the rescaled migration rate M and the heterozygosity HA in the Asian population in the x-axis). The different shadings indicate the P-value of the optimal test for the parameter values indicated. The lower the P-value, the darker is the shading in the grid.

