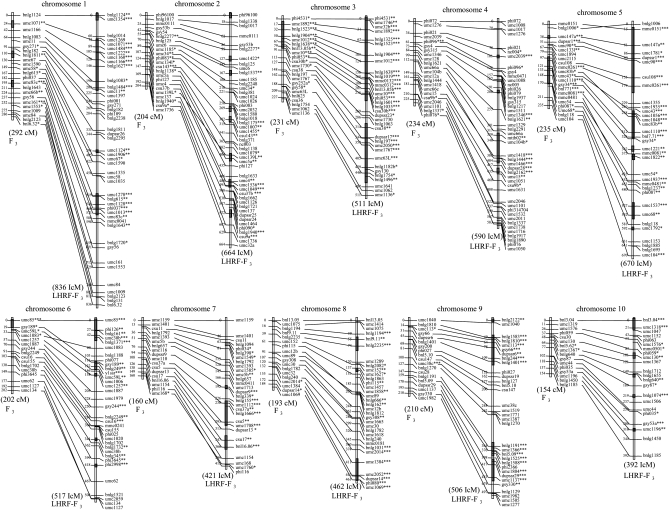
Figure 1.—
Comparative linkage maps of F3 (left) and intermated LHRF-F3 (right) populations. Marker positions are in centimorgans (cM) for the conventional F3 (using Haldane's function) and intermated centimorgans (IcM) (see text) for the intermated population. *0.05; **0.01; and ***0.001 indicate genotypic distortions at the respective levels of risk. Gray bars indicate regions where markers showed allelic bias at P = 0.001.

