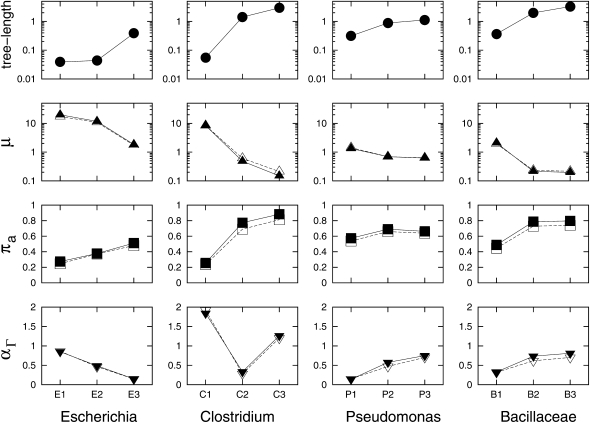
Figure 2.—
Association between estimated parameters and phylogenetic divergence in each group. Three maximum-likelihood estimates (MLEs), μ, πa, and αΓ, are estimated under the M0 + π model using different cutoff thresholds in BLASTP/TBLASTN searches. Solid symbols represent MLEs using a criterion of E-value ≤10−20 and match length ≥85%, while open symbols represent MLEs using a criterion of E-value ≤10−10 and match length ≥70%. The four groups are sorted from the least diverse group (Escherichia) on the left to the most diverse group (Bacillaceae) on the right. Although shown along with three estimates, tree length is not an estimate from the gene insertion/deletion model. Indeed, it is the sum of branch lengths based on nucleotide substitution and used as an indicator for the degree of divergence in the clade.

