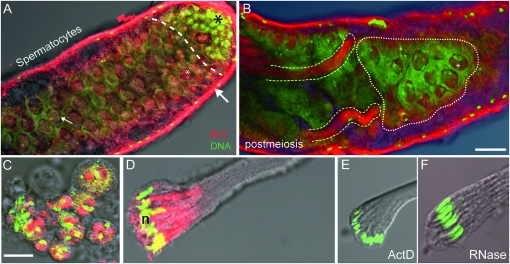
Figure 1.—
Transcription in the Drosophila testis visualized following BrU incorporation. Overlay confocal fluorescent/light microscopic images of the apical and middle regions of intact testes (upper) and individual cyst cells (lower) showing localized BrU labeling (red) and both DNA and RNA (green). (A) Apical regions showing hub and stem cell divisions and spermatogonia (black asterisk) distinct from the adjacent area that predominantly contains spermatocytes (dashed line). A strong localized BrU signal in presumptive nucleoli (white asterisk) were observed as bright red dots in nuclei of spermatocytes near the apical end and more diffuse BrU signals were observed in enlarged spermatocyte nuclei located more posteriorly (e.g., small white arrow). The bulk of BrU incorporation is observed in somatic sheath cells (large white arrow). (B) Distal midregion view of testis showing spermatocytes (white stippling) and postmeiotic spermatid bundles (yellow stippling). Diffuse BrU incorporation in spermatocyte nuclei (asterisk) and inside spermatid bundles are clearly visible. (C) Enhanced views of BrU incorporation in isolated spermatocytes and (D) elongating spermatid bundles provided clear evidence for de novo RNA transcription in postmeiotic phases. Similarly staged postmeiotic spermatid bundles treated with either (E) actinomycin D (ActD) or (F) Rnase treatment resulted in a nearly complete loss of BrU signal, providing further confirmation that the BrU signal was a consequence of RNA transcription. Methods: For these, and images shown in Figure S1, the following procedures and reagents were used (modified from Chang et al. 2000; Ohtsu et al. 2008): For BrU incorporation, testes dissected in TB1 (testis buffer 1) and treated with a mixture of BrU (100 mM) (Sigma- Aldrich) and DOTAP (0.2 μg/μl) (Roche Molecular Bio) for either 1 hr (intact testes), 30 min (meiotic cells), or 20 min (postmeiotic cells). DOTAP is a liposomal transfection reagent for the highly efficient transfection of negatively charged molecules such as RNA into eukaryotic cells. Cells were then washed three times for 5 min each with TB1. Cells were fixed and processed for indirect immunofluorescence: stained with a primary anti-bromo-deoxyuridine (anti BrdU) mouse monoclonal antibody [2 μg/μl, in BTP (PBS-T 0.1%, BSA0.5%)] (Roche Molecular Bio) for 1 hr, briefly washed three times prior to staining with a goat Cy5-cyanine anti-mouse IgG secondary antibody (Jackson Immuno Research) diluted 1/400 for 1 hr. Then, cells were imaged using a Zeiss LSM 510 confocal microscope (BrU, red; DNA, green). We note that similar results were obtained using BrUTP. Bar, 50 μm (upper); 10 μm (lower). Rnase treatment was performed using DNase-free RNase A solution at 1 mg/ml, in 2× SSC.

