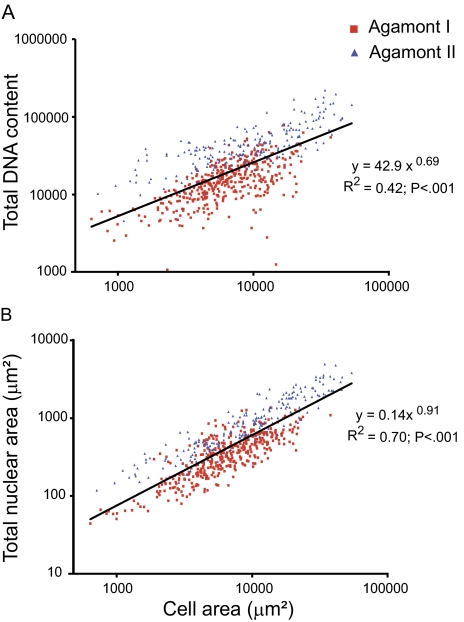
FIG. 3.—
Significant positive correlation between nuclear size and DNA content with cell size throughout life cycle. N = 610; includes all cells. (A) DNA content, as measured by intensity of DNA staining across the entire nucleus, is tightly correlated with cell area. (B) Nuclear and cell area are related by a power function. There is no difference in this relationship between Agamont I and II (analysis of covariance for difference in slope: P = 0.37).

