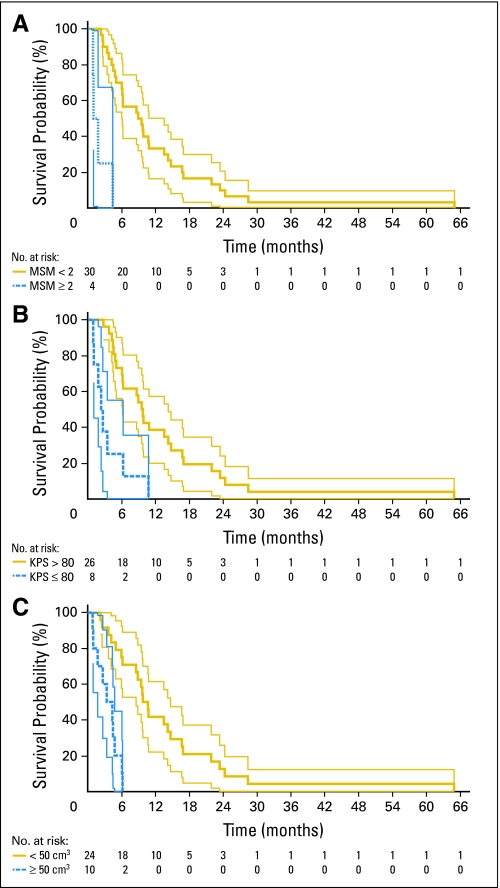
Fig 2.
Kaplan-Meier plots of variables found to be significantly associated with survival using univariate testing. (A) Motor, speech, and middle cerebral artery region (MSM) score—a tally of tumor involvement of three prespecified eloquent/critical brain areas: the presumed motor area, the presumed speech area, and the areas directly adjacent to the M1 and/or M2 segments of the middle cerebral artery. Gold line represents patients with MSM lower than 2. Blue line represents patients with MSM ≥ 2. (B) Karnofsky performance status (KPS). Gold line represents patients with KPS higher than 80. Blue line represents patients with KPS ≤ 80. (C) Tumor volume. Gold line represents patients with tumor volume smaller than 50 cm3. Blue line represents patients with tumor volume ≥ 50 cm3. For all three plots, thin light lines represent 95% CIs of the enclosed thick dark lines. Below each plot, the number of patients at risk at various time points is provided.

