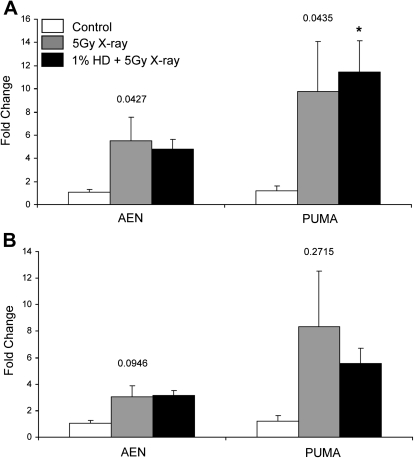
FIG. 5.
AEN and PUMA expression in whole testis tissue. (A) 3 h or (B) 12 h after x-ray exposure, mRNA was isolated from whole testis samples, and AEN and PUMA expression was measured by qRT-PCR. Gene expression values are expressed as mean relative expression ± SEM (n = 3–4). Values above the results for each gene indicate the p value for the within-gene ANOVAs that were performed. Asterisk indicates significant differences relative to the control group (p < 0.05), as determined by post hoc analysis.

