FIG. 7.
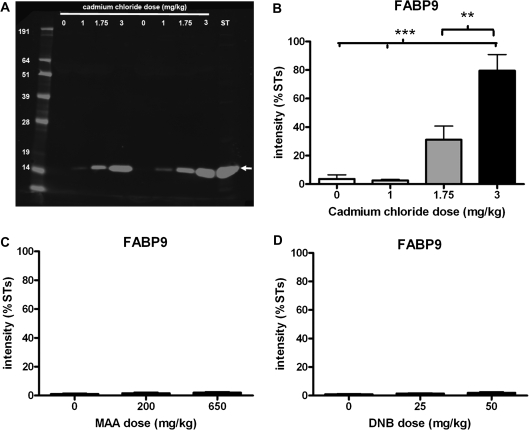
Effects of toxicant treatment on leakage of FABP9 protein into IF collected 24 h later. (A) Representative Western blot with IF samples collected 24 h following administration of 1, 1.75, or 3 mg/kg cadmium chloride or vehicle control compared with ST sample, probed with FABP9 antibody. FABP9 was detected at ∼15 kDa. (B) Quantification of FABP9 protein band (∼15 kDa) (mean + SEM) in IF from the different treatment groups. Samples (two per dose) were run on four different blots and quantification of FABP9 protein band was normalized to the ST sample run on each of the blots (n = 8, except 0 mg/kg where n = 7 and 1 mg/kg where n = 5). (C) Quantification of FABP9 protein band (∼15 kDa) in IF collected from rats treated with 200 or 650 mg/kg MAA (mean + SEM). Samples (two per dose) were run on three different blots, and quantification of VASA protein band was normalized to the ST sample run on each of the blots (n = 6 except 0 mg/kg where n = 7). (D) Quantification of FABP9 protein band (∼15 kDa) in IF collected from rats treated with 25 or 50 mg/kg DNB (mean + SEM). Samples (two per dose) were run on three different blots and quantification of FABP9 protein band was normalized to the ST sample run on each of the blots (n = 6). **p < 0.01, ***p < 0.001 compared with control IF.

