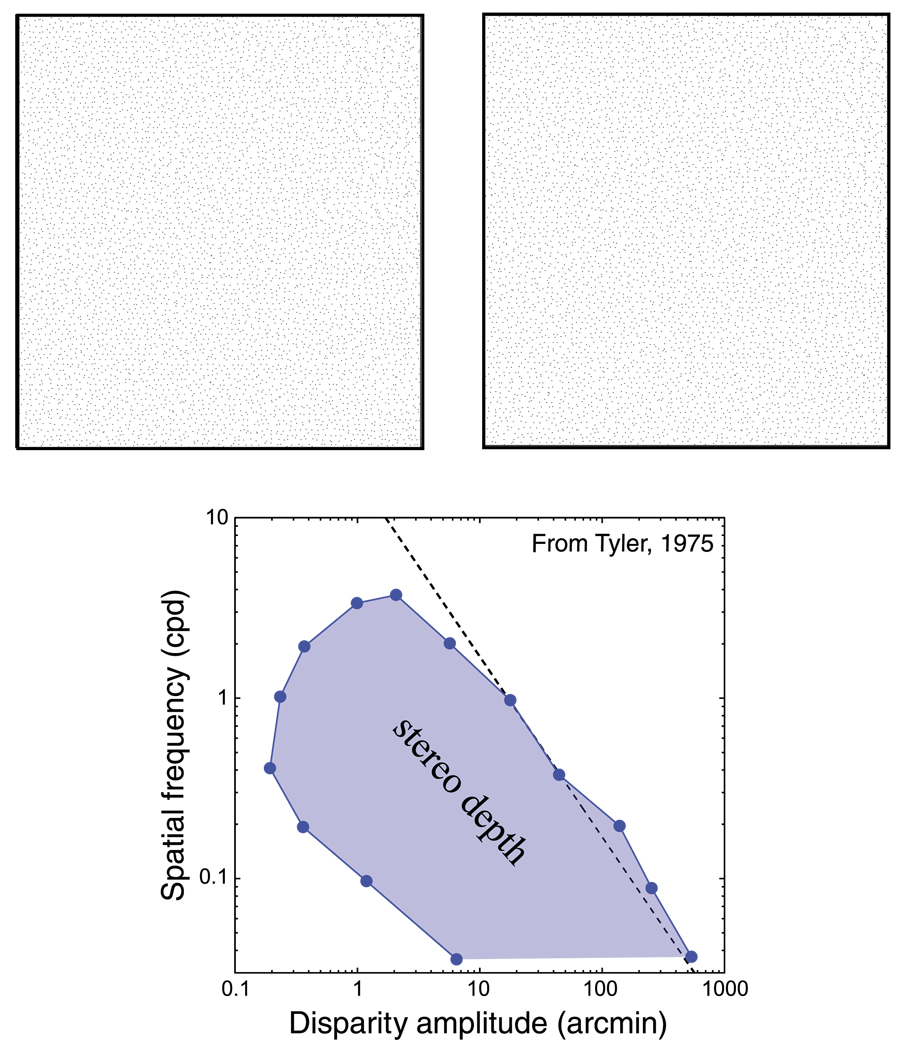
Figure 1.
Combinations of disparity and spatial frequency that yield stereoscopic depth percepts. The upper panels are a stereogram that specifies sinusoidal depth corrugations. Cross fuse or divergently fuse to see the corrugations. Disparity amplitude increases from left to right and spatial frequency from bottom to top. The lower panel is replotted from Tyler (1975). The shaded region represents the combinations of disparity amplitude and spatial frequency that produce stereoscopic depth percepts: specifically, the ability to see the depth corrugation. The unshaded region represents combinations that do not yield such percepts. Along the dashed line, the product of spatial frequency and disparity is constant. The percept from the stereogram in the upper panel corresponds roughly to the graph in the lower panel if you view the stereogram from 40 cm.

