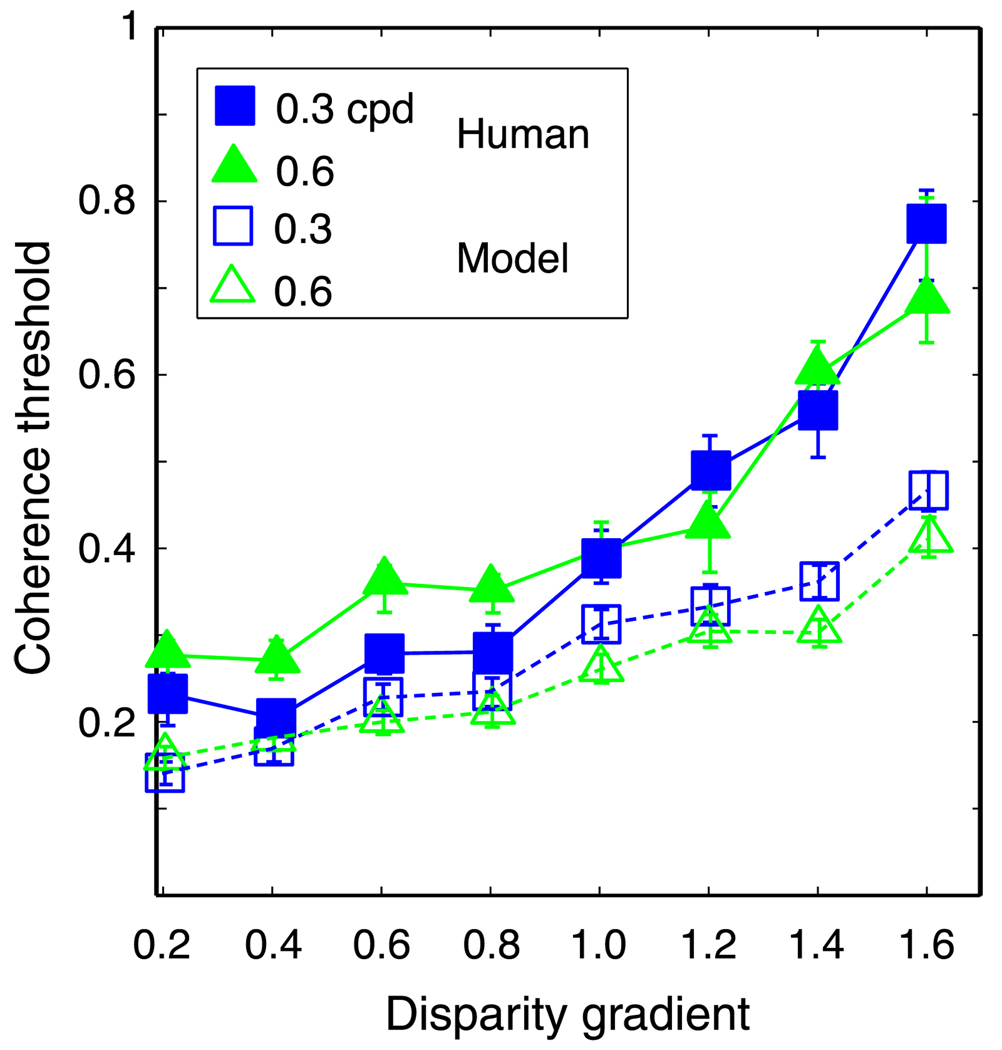
Figure 12.
Comparison of model and human performances. Coherence thresholds are plotted as a function of disparity gradient for the local cross-correlator and a representative human observer (HRF). Filled symbols are human data and unfilled symbols are model data. The size of the correlation window used in this simulation was 18 arcmin. Different symbols represent different spatial frequencies: squares and triangles for 0.3 and 0.6 cpd, respectively. Error bars are standard errors of the means calculated by bootstrapping.

