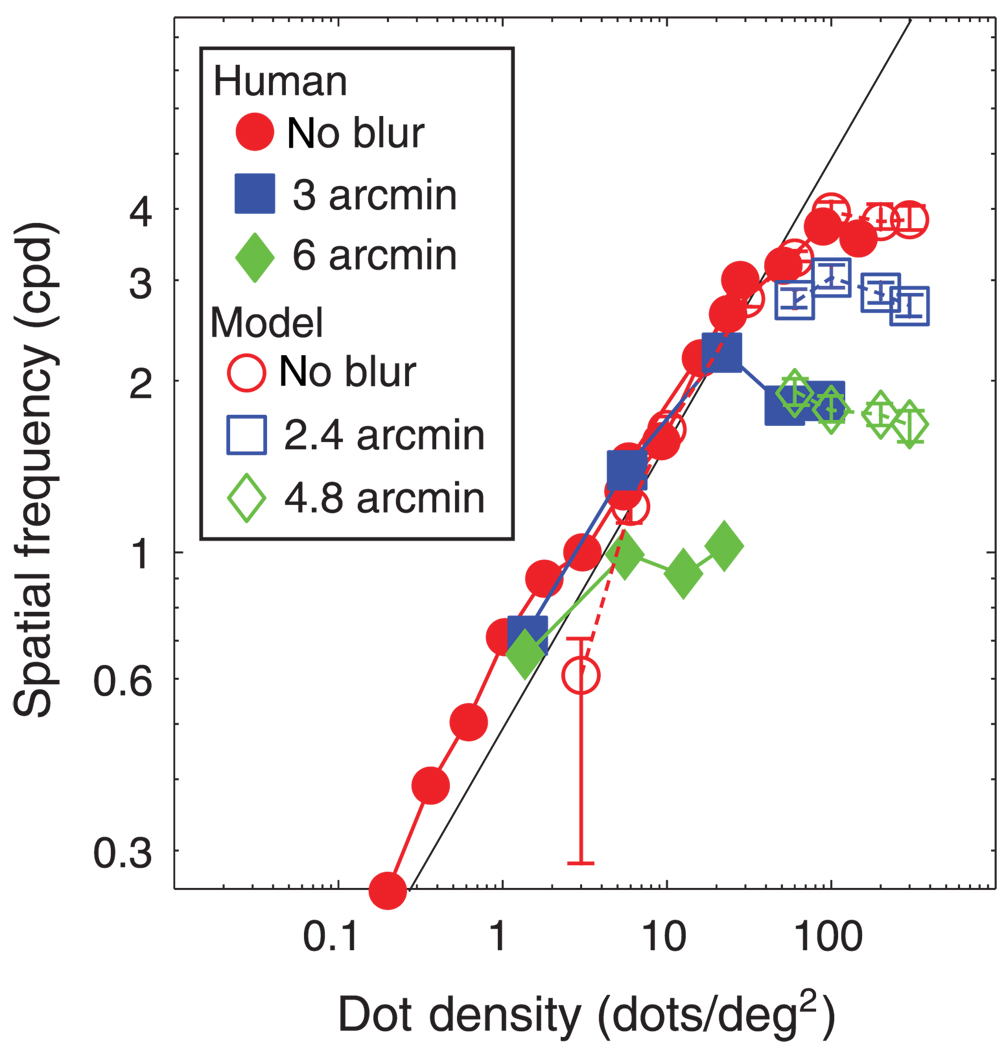
Figure 16.
Stereoresolution vs. dot density for the local cross-correlation model and human observers. Filled symbols and solid lines represent the human data and unfilled symbols and dashed lines represent model data. Different symbol types represent different blur magnitudes as indicated by the legend. The values in the legend are the standard deviations of the Gaussian blur kernel applied to the stimuli. Error bars are standard errors of the means calculated by bootstrapping. The diagonal line represents the Nyquist frequency.

