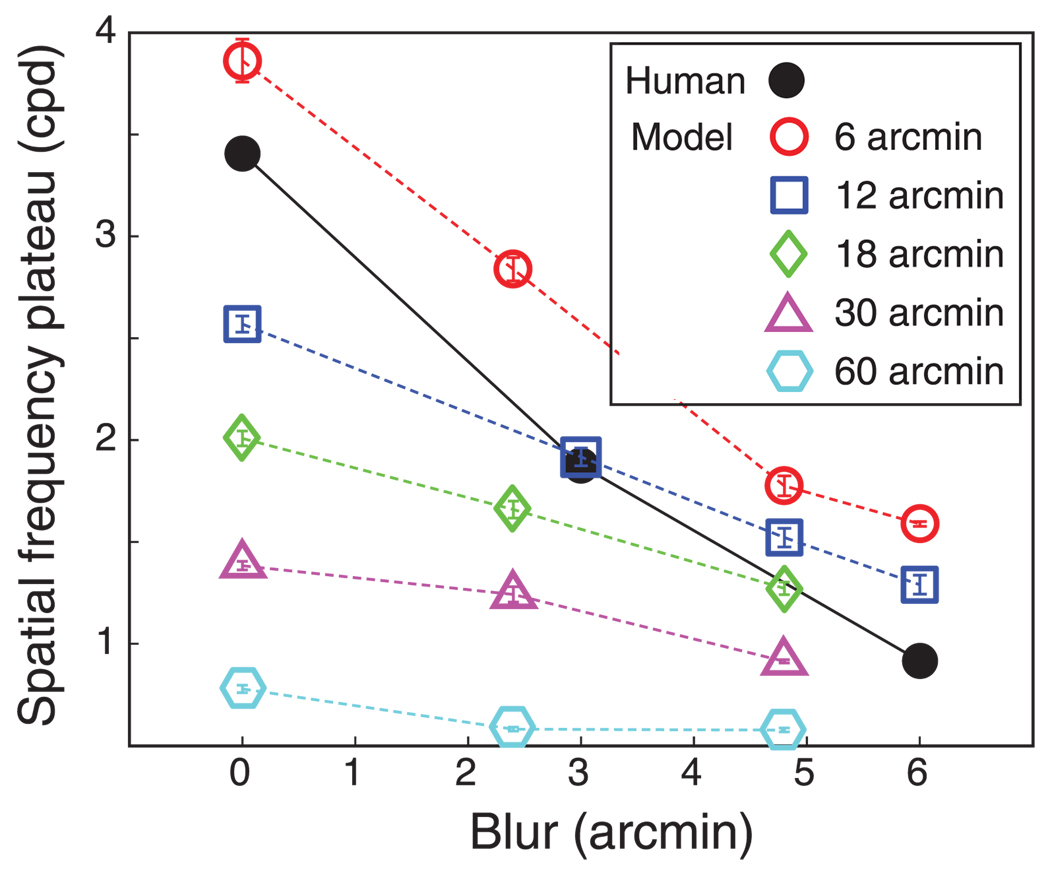
Figure 17.
Spatial frequency asymptote vs. blur for model and human results. Filled symbols and solid lines represent the human data and unfilled symbols and dashed lines represent model data. Different symbols represent different window sizes: circles, squares, diamonds, triangles, and hexagons for 6, 12, 18, 30, and 60 arcmin, respectively. Blur values are the standard deviation of the Gaussian kernel applied to the stimulus. Error bars are standard errors of the means calculated by bootstrapping.

