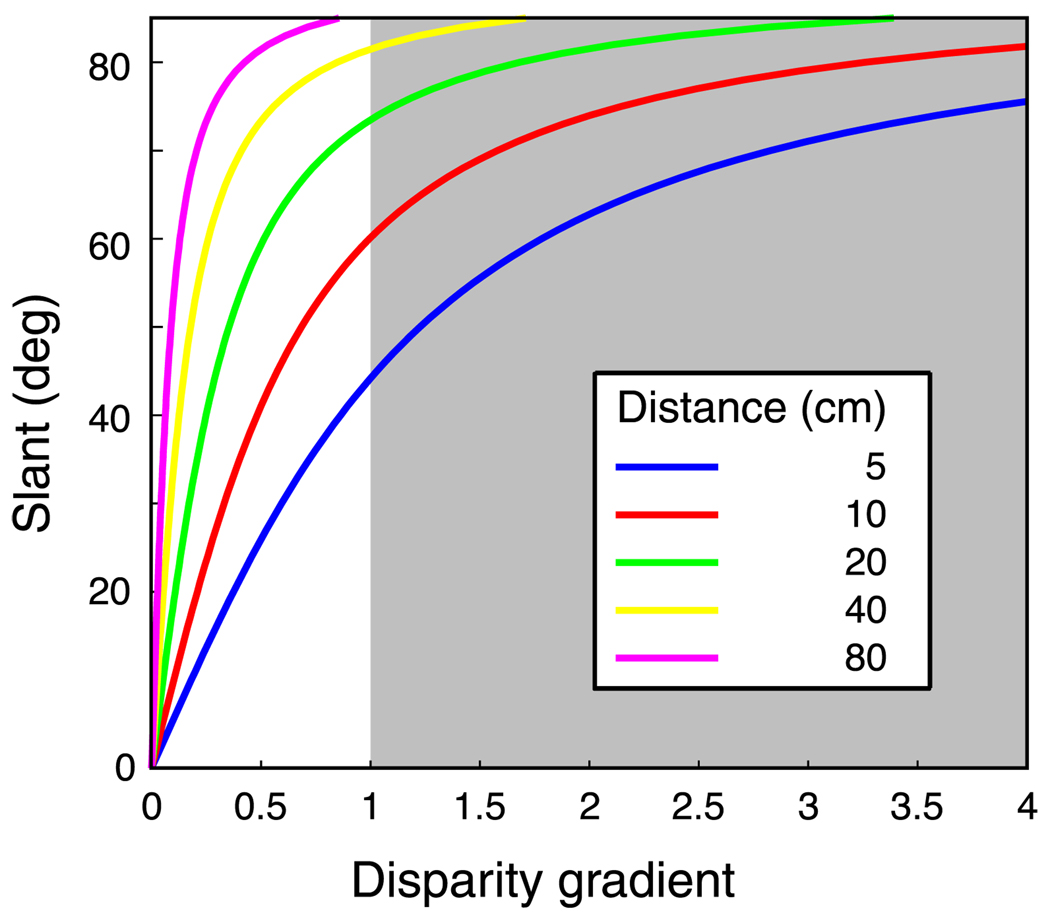
Figure 18.
Slant as a function of the disparity gradient for different viewing distances. To generate this plot, we created small opaque surface patches that were rotated about a horizontal axis (tilt = 90°). The disparity gradient was defined as the horizontal disparity divided by the separation in the direction of most rapidly increasing depth. The shaded region represents the gradients that exceed the nominal disparity-gradient limit of 1 (Burt & Julesz, 1980). This plot would be quite similar for other surface tilts.

