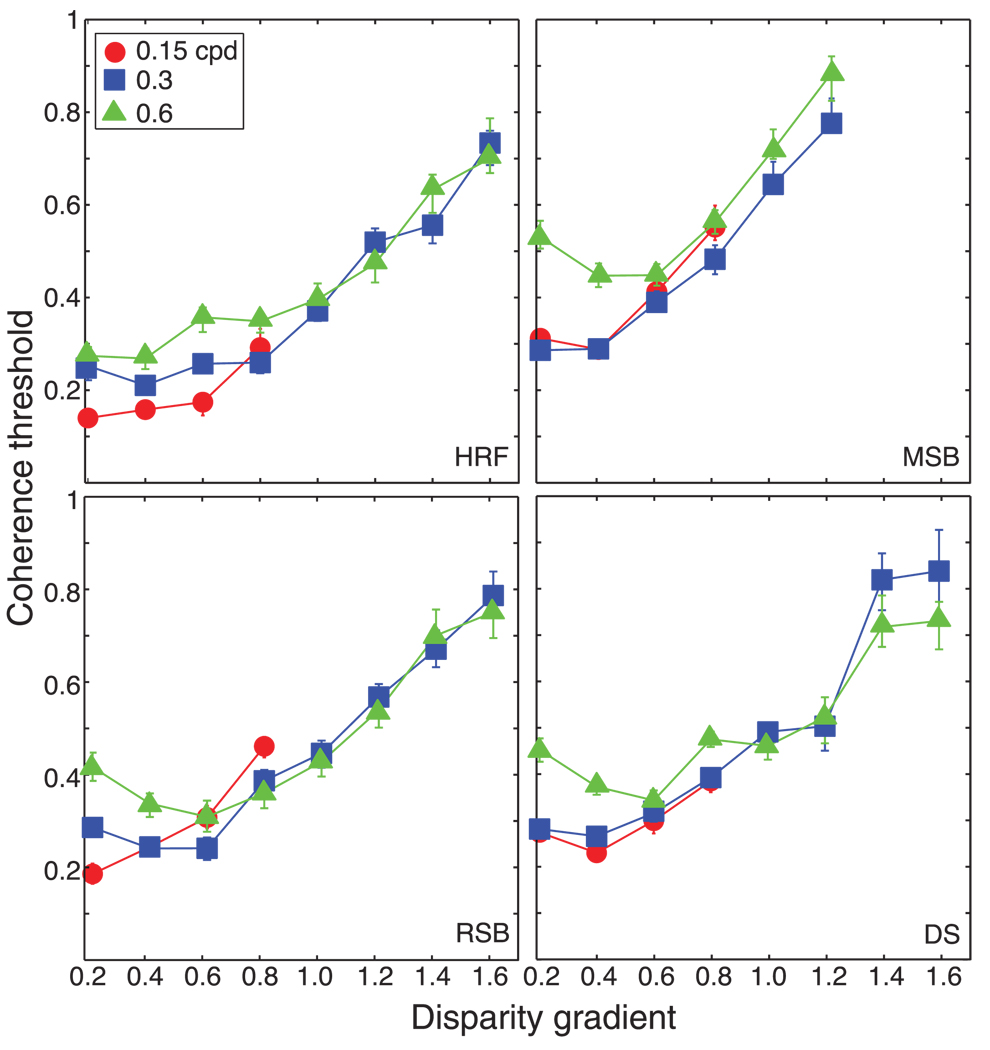
Figure 5.
Coherence threshold vs. disparity gradient for human observers. Each panel is replotted from Figure 4. The panels plot coherence threshold, the proportion of signal dots in the stimulus, as a function of the disparity gradient of the slats of the horizontal sawtooth stimulus. Different panels show data from different observers. Different symbols represent data for different spatial frequencies: circles, squares, and triangles for 0.15, 0.3, and 0.6 cpd, respectively. Error bars are standard errors of the means calculated by bootstrapping.

