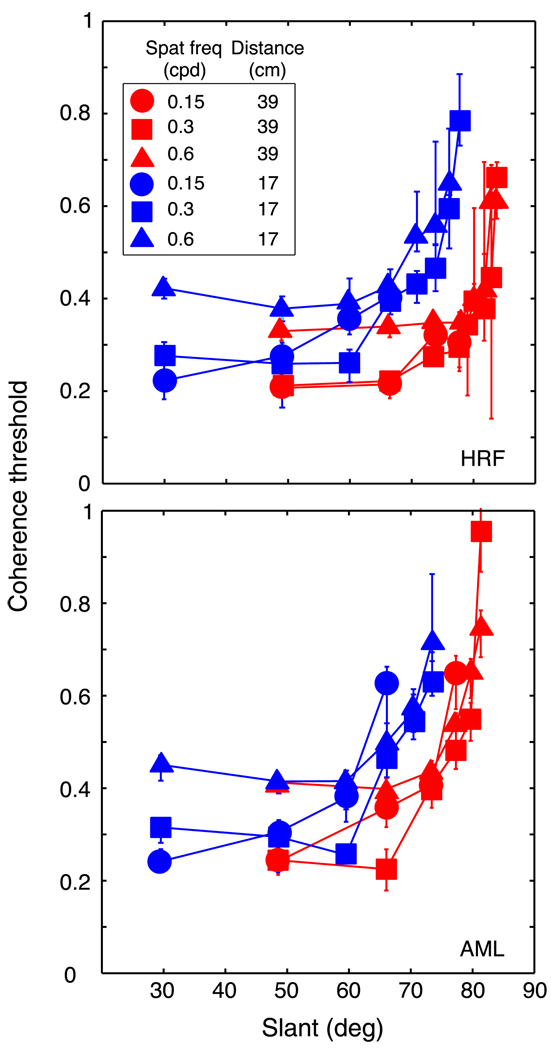
Figure 6.
Coherence threshold vs. slant for human observers. Coherence threshold, the proportion of signal dots in the stimulus, is plotted as a function of the slant of the sawtooth slats. Different panels show data from different observers. Different symbol shapes represent data for different spatial frequencies: circles, squares, and triangles for 0.15, 0.3, and 0.6 cpd, respectively. Different colors represent data from the two viewing distances: red and blue for 39 cm and 17 cm, respectively. Error bars are standard errors of the means calculated by bootstrapping.

