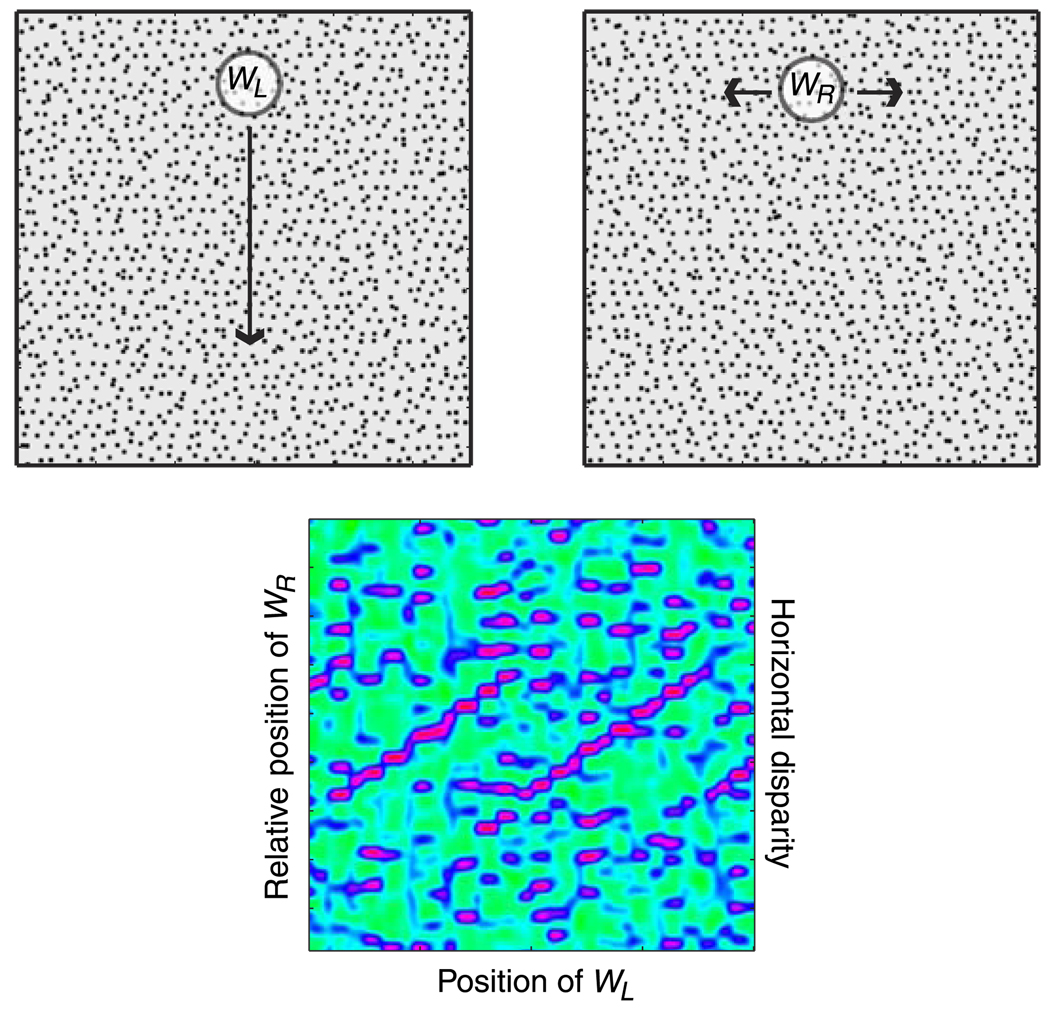
Figure 8.
Local cross-correlation model for disparity estimation. The upper two panels are the half-images presented to the model. The reader can see the sawtooth corrugation by divergent or cross fusing. A Gaussian correlation window WL is placed in the left eye’s half-image. That window was moved along a vertical line as indicated by the arrow. For each position of WL, an identical Gaussian window WR was placed in the right eye’s image, and the cross-correlation (Equation 9) was computed between the two windowed images. Throughout the manuscript, we refer to the size of WL and WR as the “window size.” By this we mean two standard deviations of the Gaussian. The lower panel shows an example of the output of the cross-correlator. The abscissa is the position of WL along the vertical line in the left eye’s image, and the ordinate is the relative horizontal position of WR; this corresponds to the horizontal disparity. Correlation is represented by color, red for correlations approaching 1, green for correlations near 0, and blue for correlations between −1 and 0. In this example, the sawtooth is revealed by ridges of high correlation.

