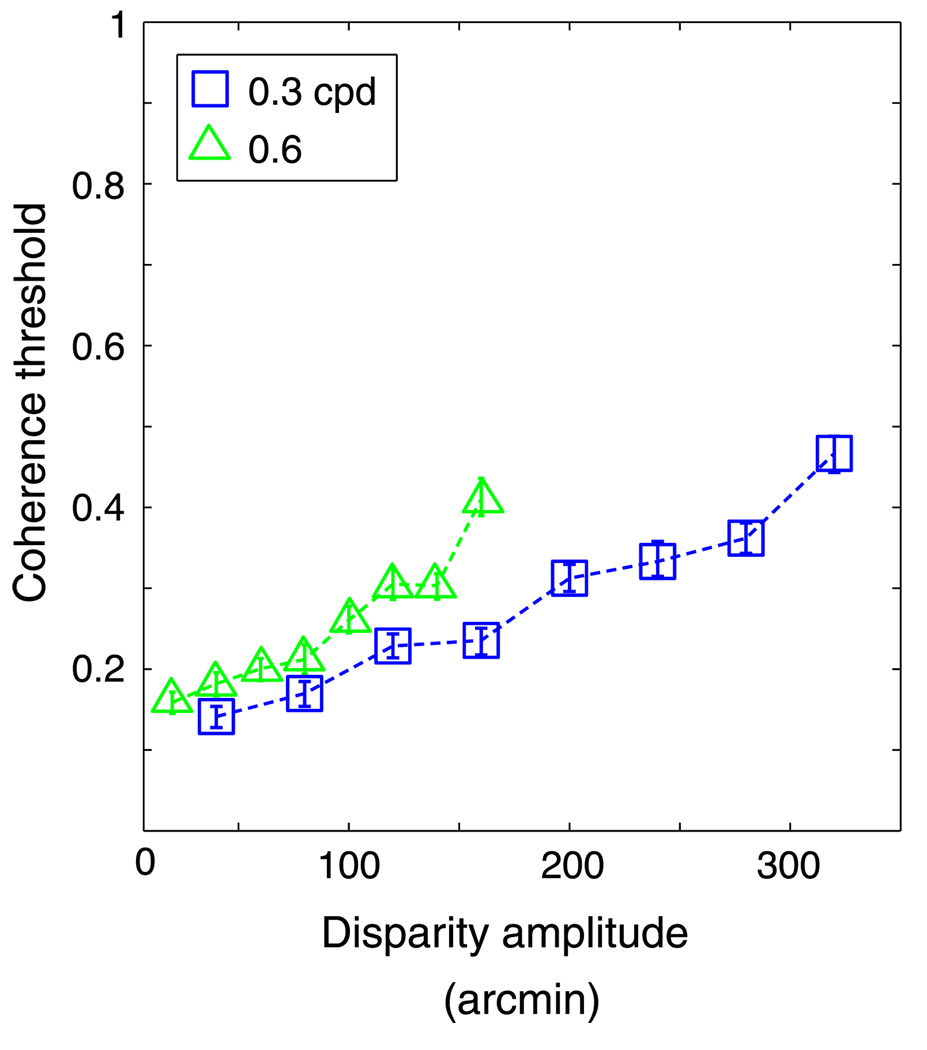
Figure 9.
Coherence threshold vs. disparity amplitude for the cross-correlation model. Coherence threshold, the proportion of signal dots in the stimulus, is plotted as a function of the disparity amplitude of the horizontal sawtooth stimulus. The size of the correlation window used in this simulation was 18 arcmin (recall that refers to ±1 standard deviation of the Gaussian window). Different symbols represent different spatial frequencies: squares and triangles for 0.3 and 0.6 cpd, respectively. Error bars are standard errors of the means calculated by bootstrapping.

