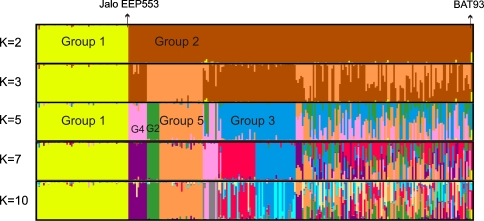
Fig. 2.
Structure bar plot of membership coefficients for all the accessions of common bean in the study sample sorted in the same order and classified according to successive selected preset K values ranging from 2 to 10. For K = 2 and K = 5, the groups are identified. G2 and G4: groups 2 and 4, respectively. Hybrid represents a large group of accessions resulting from hybridization mostly among Mesoamerican groups

