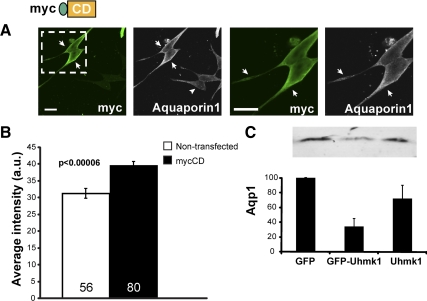
Figure 9.
Verification of a role for PAM-CD. A, AtT-20 cells transiently transfected with a vector encoding mycCD were fixed 48 h later and stained simultaneously for endogenous Aqp1 (white) and exogenous mycCD (green; C-stop antibody); boxed area in left panel is enlarged in right panel. Arrows indicate transfected cells; arrowhead indicates nontransfected cell. In cells expressing high levels of mycCD, staining for endogenous Aqp1 increased, especially near the cell surface. Scale bar, 20 μm. B, Aqp1 staining intensity in nontransfected (n = 56) and mycCD-expressing (n = 80) cells was quantified with the Nikon imaging software NIS-Elements; data are mean ± sem (t test, unequal variance). C, AtT-20 cells expressing GFP, GFP-Uhmk1, or GFP and Uhmk1 expressed from a dual promoter vector were FACS sorted; for each sample, 30,000 cells were subjected to Western blot analysis for Aqp1. Error bars, sd (STDEV).

