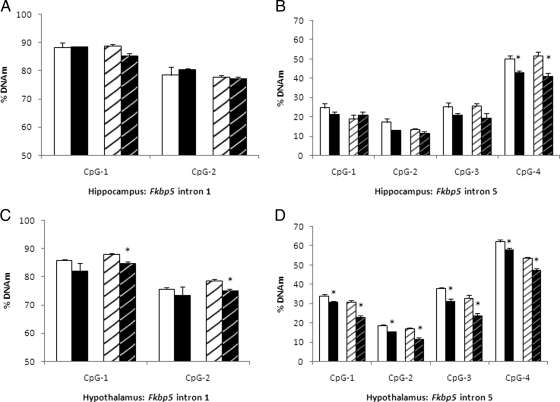
Figure 4.
Assessment of hippocampal and hypothalamic Fkbp5 methylation in the two intronic regions. Percent methylation at two CpG positions is shown for hippocampal Fkbp5 intron 1 region (A) and four CpG positions for the intron 5 region (B). Each intronic region was assayed for both CORT (black bars) and control (white bars) groups. Solid bars on the left indicate the treatment phase, whereas striped bars on the right indicate the recovery phase. The comparable data for the hypothalamus is shown in C and D. Asterisks represent statistically significant differences between the CORT and control groups.

