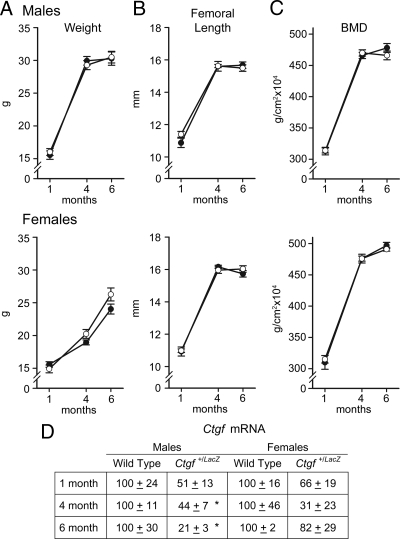
Figure 2.
Weight, femoral length, BMD, and Ctgf mRNA expression in male (upper panels) and female (lower panels) Ctgf+/LacZ heterozygous null mice (•) and wild-type littermate controls (○). The weight in grams (A), femoral length in millimeters (B), total BMD in grams per square centimeter (C), and Ctgf mRNA levels in total calvarial extracts (D), expressed as Ctgf copy number corrected for Rpl38 and normalized to 100 at 1, 4, and 6 months of age, are shown. Values are means ± sem (n = 5–17) except for mRNA levels, which are expressed as percentage of control for each independent age (n = 3–4). * Significantly different from control mice, P < 0.05.

