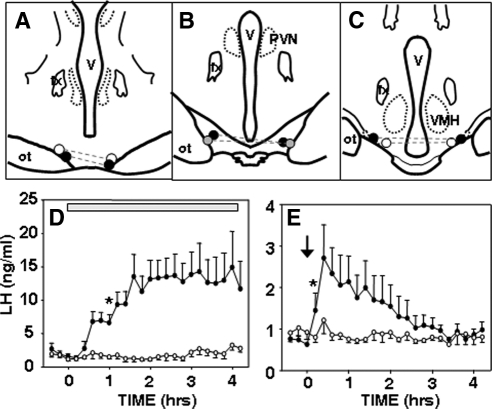
Figure 4.
Effect of local administration of senktide to the RCh of ovary-intact anestrous ewes. A–C, Positions of microimplants and microinjections in schematic coronal sections through the RCh, with bilateral sites in the same ewe connected by dashed lines. Solid circles denote ewes with a robust response to senktide microinjection (peak LH > 4 ng/ml); shaded circles denote ewe with modest response (peak LH < 2 ng/ml); and open circles denote ewes with no response to senktide microinjection. All six ewes responded to the microimplants. D, Mean (±sem, n = 6) LH concentrations before and after insertion of either empty (open circles) or senktide-containing (closed circles) microimplants (horizontal bar). There was a significant treatment effect (P < 0.01) and a time × treatment interaction (P < 0.001) (two-way ANOVA with repeated measures). E, Mean (±sem, n = 6) LH concentrations before and after bilateral microinjection (arrow) of vehicle (open circles) or 3 pmol senktide (closed circles) into the RCh. There was a significant (P < 0.05) time × treatment interaction (two-way ANOVA with repeated measures). Asterisks in D and E depict the first time at which there was a statistically significant difference between LH concentrations after senktide and control treatments, based on the Tukey test for multiple comparisons. All subsequent comparisons were significantly different in D, but only the next five time points were different after the microinjection (E).

