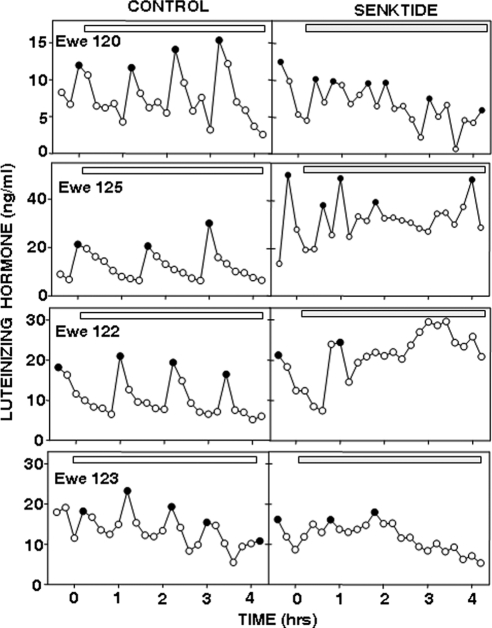
Figure 5.
LH pulse patterns in four OVX ewes during anestrus before and after insertion of empty (left panels) and senktide-containing (right panels) microimplants (horizontal bars) into the RCh. Solid circles depict the peak of LH pulses. Note differences in y-axes. Microimplant sites are indicated in Fig. 4, A–C. Ewe 120, shaded circles (B); ewe 122, open circles (C); ewe 123, open circles (A); and ewe 125, solid circles (C).

