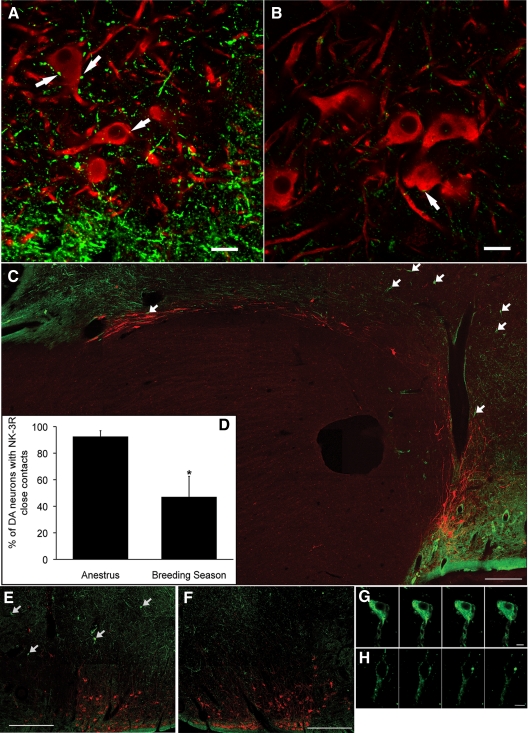
Figure 6.
NK3R and tyrosine hydroxylase dual immunofluorescence labeling in the ovine hypothalamus. A and B, Confocal images of coronal sections through the RCh from OVX+E2 anestrous (A) and breeding season (B) ewes showing NK3R-ir fibers (green) and tyrosine hydroxylase-ir cell bodies (red). Arrows indicate some NK3R-containing varicosities in close contact to A15 cells. Images captured using ×63 objective, ×0.7 optical zoom, and 1.5-μm z-section. Scale bar, 20 μm. C, Montage of confocal images of a parasagittal section illustrating a continuum of NK3R-ir fibers and tyrosine hydroxylase-positive cells along the border of the optic chiasm. Arrows indicate NK3R-positive cell bodies. Images captured using ×10 objective and 15-μm z-thickness. Scale bar, 500 μm. D, Seasonal comparison of the percentage of A15 DA neurons receiving NK3R-containing close contacts. *, P < 0.05. E–H, Confocal images of NK3R-ir neurons (arrows in E) at low (×10 objective and 15-μm z-thickness; E and F) and high (×63 objective and 1-μm z-thickness; G and H) magnification ipsilateral (E and G) and contralateral (F and H) to local injection of senktide. Panels in G and H are a series of z-sections (1 μm) through a single neuron. Scale bars, 500 μm (E and F) and 10 μm (G and H).

