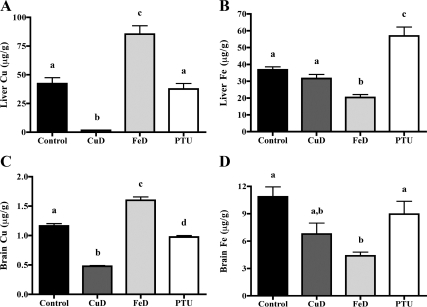
Figure 1.
Cu and Fe content of P12 pup brains and livers. A, Liver Cu content. B, Liver Fe content. C, Brain Cu content. D, Brain Fe content. Cu and Fe content was measured in livers and half brains from P12 male pups (n = 5 for control, FeD, and PTU; n = 4 for CuD; for liver Fe measurement n = 4 for PTU) by flame AAS. Data are presented as the mean ± sem. Bars with unlike letters indicate a statistical difference (P < 0.05) by one-way ANOVA and Tukey’s or Scheffé’s multiple comparison test.

