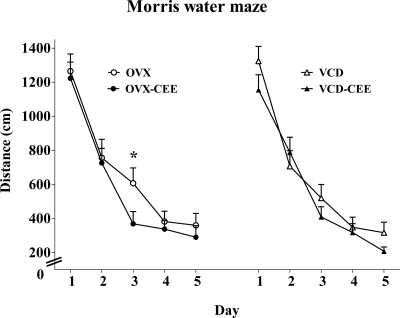
Figure 4.
Mean ± se distance on the MWM for d 1–5. Group comparisons set post hoc revealed that on d 3 OVX-CEE rats showed decreased distance scores relative to OVX rats (P = 0.05). There was no CEE effect on this day for VCD-treated animals (P = 0.32). Thus, CEE enhanced performance in OVX rats but not VCD rats on d 3 of MWM testing, indicating faster learning by the OVX-CEE group.

