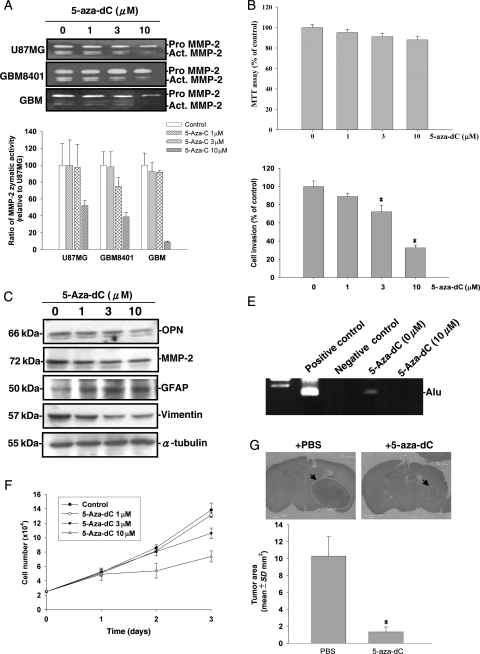
Fig. 6.
Human glioma cell lines were treated with different concentrations of 5-aza-dC. (A) Media were then collected for a zymographic assay for MMP-2 activity. In the lower panel, effects of 5-aza-dC on MMP-2 secretion in various cells were quantitated by scanning the photographic negatives on a gel analysis system and are expressed as a percent of basal level for each cell line. (B) Cell viability was analyzed by the MTT assay after incubation of U87MG cells with 5-aza-dC for 24 hours. (C) Cell lysates were harvested and immunoblotted with antibodies specific for OPN, MMP-2, GFAP, vimentin, and α-tubulin. (D) For the in vitro invasion assay, equal numbers of glioma cells were seeded in the upper part of a transwell coated with Matrigel in the presence of different concentrations of 5-aza-dC. After 24 hours, cells on the bottom side of the filter were fixed, stained, and counted. Data represent the mean ± SE of three independent experiments. (E) An intravasation assay was carried out. PCR amplification for Alu sequence is shown. P, positive control; N, negative control. (F) A trypan blue exclusion assay was carried out after treating cells with different concentrations of 5-aza-dC in 5% FBS medium for different time periods. Data represent the mean ± SE of three independent experiments. (G) Measurement of implanted tumor sizes in mice without or with 5-aza-dC administration. Tumor sizes were measured through their largest diameter (upper panel), and the lower panel shows the mean ± SE of three independent experiments. *P < .05, compared with basal level.

