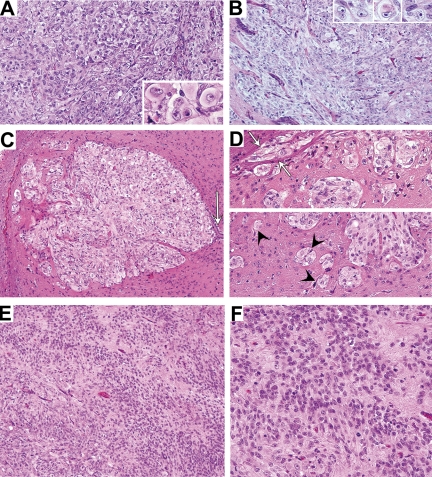
Fig. 3.
Xenografts from the primary surgical tissue. Both the subcutaneous (A) and orthotopic (B) xenografts displayed conspicuous populations of rhabdoid cells. (C) Supratentorial xenograft showing ventricular involvement and nodular expansion into adjacent brain. Note the remnant of the ependymal layer (arrow). Higher magnification of another supratentorial tumor (D) shows small nests of perivascular tumor cells (arrow heads) in addition to tumor cells spreading into white matter tracts (arrows). (E) and (F) Larger orthotopic xenografts showed zones of tumor cells with ill-defined cytoplasmic processes.

