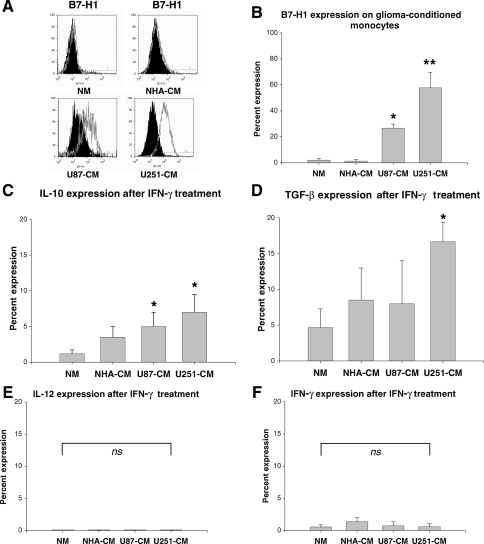
Fig. 2.
In vitro GCM have an immunosuppressive molecular profile. (A) Representative histograms showing B7-H1 expression in GCM, but not naïve or astrocyte-conditioned monocytes. NM, naïve monocytes; NHA-CM, normal human astrocytes-conditioned monocytes; U87-CM, U87-conditioned monocytes; U251-CM, U251-conditioned monocytes. (B) Graph showing percentage of cells expressing B7-H1 among NM and CM. U87-CM and U251-CM expressed significantly more B7-H1 than NM or NHA-CM. (C) Graph showing percentage of cells expressing IL-10 among NM and CM. U87-CM and U251-CM express significantly more IL-10 than NM. (D) Graph showing percentage of cells expressing TGF-β among NM and CM. U251-CM expressed significantly more TGF-β than NM. (E) Graph showing percentage of cells expressing IL-12 among NM and CM. IL-12 expression is minimal under all conditions and does not vary significantly. (F) Graph showing percentage of cells expressing IFN-γ among NM and CM. IFN-γ expression is minimal under all conditions and does not vary significantly. The scale in (C)–(F) have been kept uniform in order to allow easier relative comparisons between immunosuppressive (IL-10, TGF-β) and proinflammatory (IL-12, IFN-γ) cytokines. All graphs show mean ± SEM of three separate experiments using different PBMC donors. *P < .05; **P < .01; ns,not significant.

