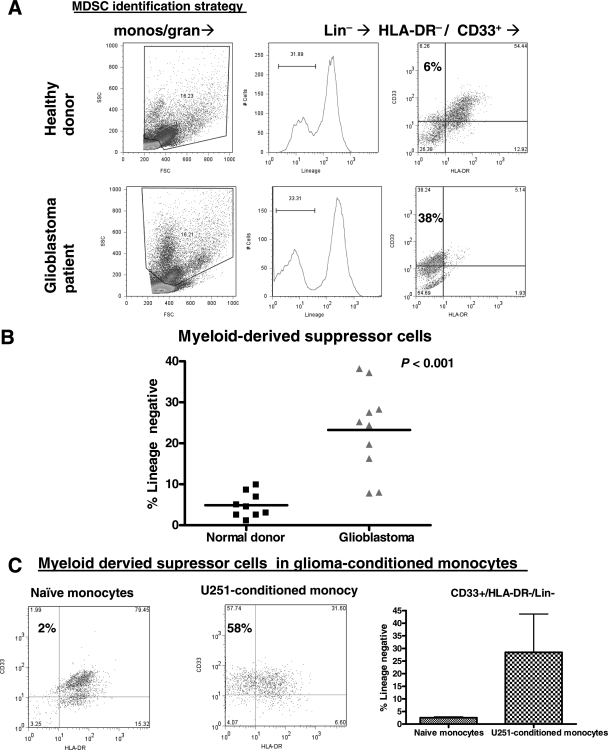
Fig. 5.
MDSC are increased in glioma patients' blood and GCM in vitro. (A) Representative dot plots and histograms showing strategy for determining MDSC frequency in peripheral blood. After gating on monocytes/granulocytes by forward and side scatter, lineage negative/HLA-DR−/CD33+ MDSC were identified in patients and normal donors. (B) Glioma patients had increased MDSC (expressed as a percentage of Lin− cells) compared with normal donors. (C) Representative dot plots demonstrating CD33 and HLA-DR expression patterns in lineage-negative monocytic/granulocytic cells from among NM and U251-CM. The glioma (U251)-CM have consistently increased CD33+/HLA-DR−/Lin− MDSC (n = 3).

