Fig. 1.
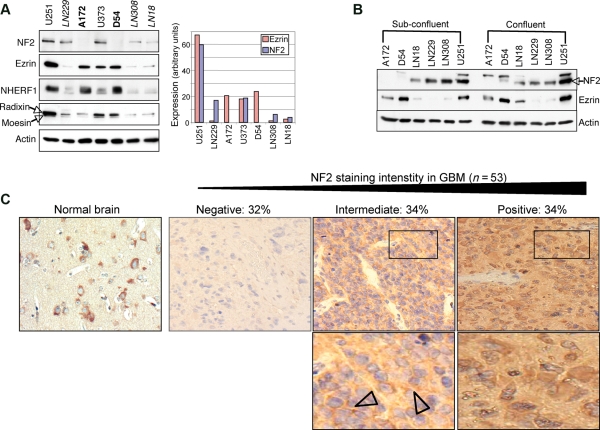
NF2 and ezrin expression patterns in GBM. (A) Western blot analysis with indicated antibodies of protein extracts from 7 GBM cell lines shows 3 ERM–NF2 expression patterns grouped and labeled in either regular, bold, or italic letters. The graph shows the quantification of NF2 and ezrin levels normalized to actin levels performed with Image J program (NIH). (B) Western blot analysis shows varying NF2 levels, in cells rated as 70% (Sub-confluent) and 100% (Confluent). Arrowhead indicates NF2. (C) Immunohistochemistry analysis (×40) with NF2 antibody of GBM tissue microarray (n = 53 samples) showing the patterns of progressive loss of NF2 staining and the corresponding % of tumors. The lower zoomed fields (rectangles) show cytoplasmic and membrane (arrowheads) NF2 localization in tumors with intermediate staining and mainly cytoplasmic localization in tumors with pronounced positive staining. NF2 intensity was quantified by ImageJ software and intensity scores were computed as x = [255–(gray scale value)]. Tumors were scored as NF2 positive (x ≥ 90), intermediate (36 < x < 90), or negative (x ≤ 36).

