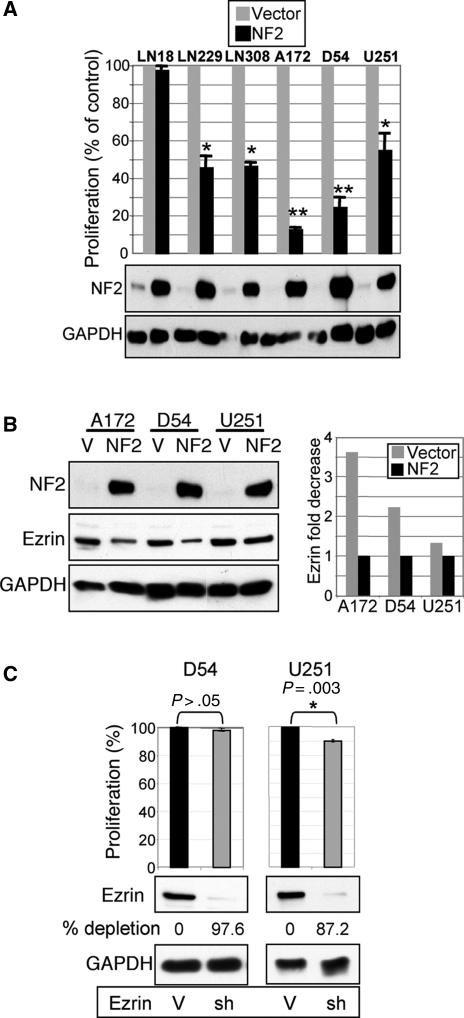
Fig. 2.
NF2 suppresses proliferation and decreases ezrin expression in GBM cell lines. (A) Proliferation analysis of indicated GBM cell lines stably expressing either NF2 or vector control. The lower panels show the corresponding NF2 and control GAPDH expression levels. (B) NF2 overexpression decreases endogenous ezrin levels in the indicated GBM cells compared with vector control cells (V). The densitometry quantification of ezrin levels normalized to GAPDH levels is shown. (C) Ezrin depletion by shRNA (sh-11) in NF2-negative D54 cells showed 97.6% expression decrease but no proliferation change compared with vector control (V). In contrast, ezrin depletion in NF2-positive U251 cells induced a small but very reproducible proliferation decrease. Values represent means ± SEM from 3 independent experiments. Statistically significant differences relative to vector control were calculated by using paired t-test and are marked with a single (P ≤ .01) or double (P ≤ .005) asterisk.

