Fig. 4.
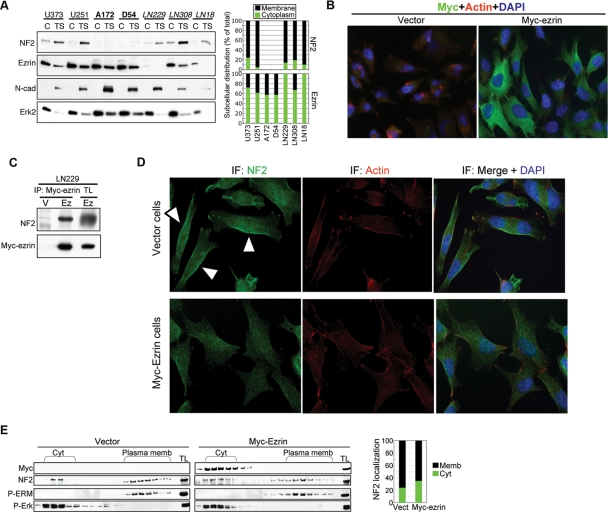
Ezrin interacts and delocalizes NF2 in GBM cells. (A) Fractionation in cytoplasmic (C) and membrane Triton X-soluble fractions (TS) shows the subcellular localization of endogenous NF2 and ezrin in the GBM cell lines grouped as in Fig. 1A. Erk2 and N-cadherin (N-cad) were used as cytoplasmic and membrane fractionation markers, respectively. The densitometric intensities of the cytoplasmic and membrane bands of NF2 or ezrin are represented graphically as percentage from the summed cytosolic and membrane distributions. (B) Immunofluorescence analysis (×40) of LN229 cells containing vector or Myc-tagged ezrin (Myc-ezrin) for ezrin (Myc), actin (Rhodamin-phalloidin), and nucleus (DAPI) detection. Images were acquired with MetaVue program using a Leica Epifluorescence Inverted Microscope. These cells were obtained by infection with retroviruses containing vector or Myc-ezrin. The efficiency of infection was almost 100% in these experiments and all cells expressed Myc-ezrin to various extents. (C) Coimmunoprecipitation of Myc-tagged ezrin with endogenous NF2 from LN229 cells overexpressing Myc-tagged ezrin (Ez) or vector control (V). TL, total lysate. (D) Immunofluorescence analysis with NF2 antibody of the cells from (B) that express either vector or Myc-ezrin, as indicated on the left. Arrowheads indicate membrane NF2 in vector-expressing cells. Note decreased membrane localization of endogenous NF2 in the cells expressing Myc-ezrin. (E) The vector and Myc-ezrin-expressing cells from (B) were subjected to sucrose gradient fractionation to separate cytoplasm (Cyt) and membrane (plasma memb) compartments. The fractions were analyzed with the antibodies indicated on the left. P-ERM and P-Erk were used as plasma membrane and cytoplasmic fractionation markers, respectively. Note extended cytoplasmic cofractionation of endogenous NF2 with Myc-tagged ezrin. TL, total cell lysate. The densitometry analysis shows the cytoplasmic and membrane distribution of NF2 in the vector- and Myc-ezrin-expressing cells. The intensities of the individual bands were measured with Image J program. These were summed separately for the cytoplasmic or the membrane fractions and computed to a percentage from the total summed distribution.

