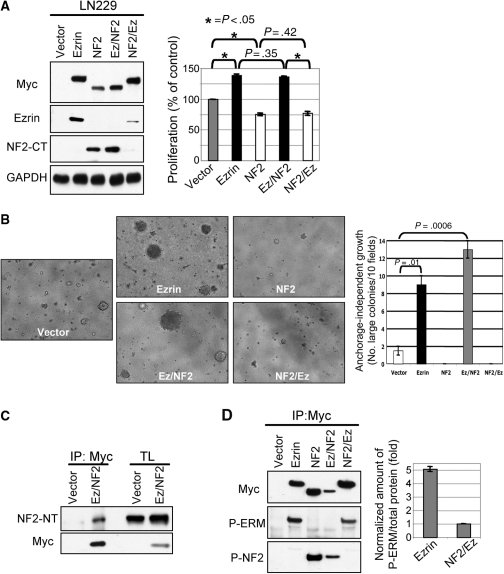
Fig. 6.
The FERM domain controls the opposite phenotype of ezrin and NF2. (A) Proliferation of LN229 cells expressing ezrin, NF2, and chimeric ezrin-NF2 proteins, as shown in the Western blot panels. Ezrin and NF2 antibodies detect the C-terminal (CT) region of the proteins. (B) The anchorage-independent growth was assessed by colony formation assay after 3 weeks of incubation in soft agar. Images (10×) were acquired on a Zeiss Axiovert 200 microscope using the Cool SNAP ES Photometrics Camera (Ropert Scientific) and Meta Imaging Corporation Series software (Universal Imaging). Colonies were counted in 10 different fields from duplicate plates. Large colonies presented a diameter > 2 mm and their average numbers ± SD are represented graphically. Statistically significant differences relative to vector control were calculated by using the t-test. (C) Coimmunoprecipitation of Myc-tagged Ez/NF2 chimera with endogenous NF2 in LN229 cells. The precipitated sample was probed with an NF2 antibody recognizing the N-terminal (NT) region to reveal only endogenous NF2 (upper panel) and further re-probed with anti-Myc antibody to reveal Myc-tagged Ez/NF2 (lower panel). (D) Immunoprecipitation of Myc-tagged proteins expressed in D54 cells followed by Western blotting with indicated antibodies show phosphorylation of the C-terminal residues in all proteins. To quantify the relative phosphorylation on Thr567 of ezrin and NF2/Ez, the intensities of the P-ERM bands were normalized to those of the Myc bands (total protein immunoprecipitated) and the analysis is shown in the graph as mean ± SEM from 3 separate experiments.

