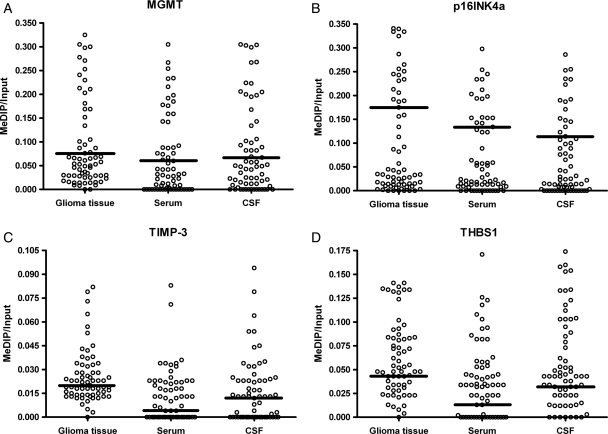
Fig. 1.
Methylation levels of MGMT, p16INK4a, TIMP-3, and THBS1 in glioma tumor tissue as well as paired serum and CSF DNA of malignant glioma patients. Calculation of the MeDIP gene of interest/input gene of interest ratios was based on the fluorescence emission intensity values for both the immunoprecipitated methylated DNA and input genomic DNA of each individual gene and sample obtained by quantitative real-time PCR analysis. Black bars denote the calculated cutoff values that best segregated patients into good and poor prognostic groups.

