Fig. 2.
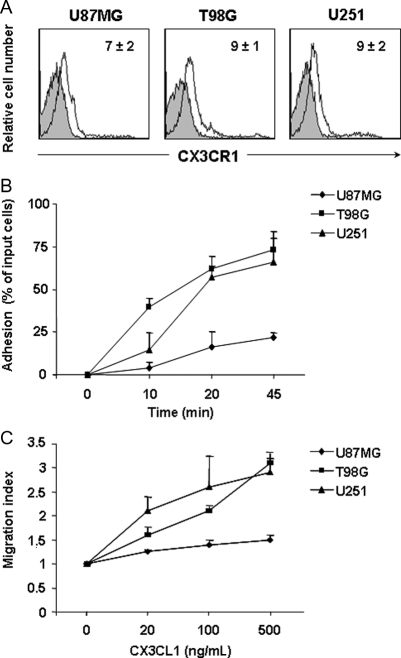
CX3CR1 is functionally expressed on glioma cell lines. (A) CX3CR1 cell surface expression on glioma cell lines was revealed by staining with a specific PE-labeled anti-CX3CR1 mAb. Shown are the histogram plot overlays of anti-CX3CR1 mAb staining (empty histogram) against IC mAb (grey histogram). Numbers in the histograms indicate the average ± SD of the MFI of at least 3 independent experiments performed. MFI of control staining was always <3. (B) Glioma cell adhesion was performed on CX3CL1 immobilized on plastic. Cells were allowed to adhere for 10, 20, and 45 minutes. Adherent cells were collected after repeated washings and quantified as positive events in 60 second acquisitions by flow cytometric analysis. Adhesion to BSA was subtracted and was always <5%. Data are expressed as percent of input cells and represent the mean ± SD of 3 independent experiments. (C) In vitro chemotaxis assay was performed using 48 well-chemotaxis chamber. Increasing doses of CX3CL1 were added in the lower well. Migration was quantified as the average number of 6 randomly selected fields at 400× microscopy magnification. Experiments were performed in triplicate. Results presented are the mean ± SD of 3 independent experiments.

