Fig. 5.
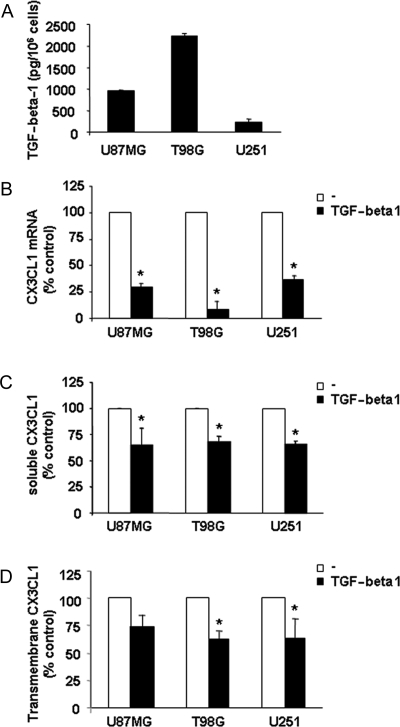
TGF-beta1 down-modulates CX3CL1 expression in glioma cell lines. (A) TGF-beta1 levels were evaluated in the supernatants of glioma cells after 18 hours culture by ELISA assay. Histograms represent the mean ± SD of at least 5 independent experiments performed. (B) CX3CL1 mRNA was analyzed by RT–PCR on 3 glioma cell lines following 18 hours culture with or without (–) recombinant human TGF-beta1 (10 ng/mL) at 37°C, 5% CO2. Data, expressed as the mean ± SD of arbitrary units and derived from 3 independent experiments, were normalized with beta-actin, and referred as percent of untreated cells considered as calibrator. (C) Soluble CX3CL1 (sCX3CL1) levels were evaluated in the supernatants of glioma cells following 18 hours of stimulation with TGF-beta1 (10 ng/mL) by ELISA assay. Histograms represent the percentage of the mean ± SD of CX3CL1 concentration relative to untreated control (–) from at least 4 independent experiments performed. (D) Expression of cell surface-associated CX3CL1 in glioma cell lines following TGFbeta-1 (10 ng/mL) stimulation for 18 hours at 37°C, 5% CO2 detected by immunofluorescence and FACS analysis using a specific anti-CX3CL1 mAb. Histograms represent the percentage of the mean ± SD of CX3CL1 MFI relative to untreated control (–) from at least 4 independent experiments performed. In B, C, and D, Student's t-test was performed by comparing TGF-beta1 treated cell values with untreated cell values. *P < .05.

