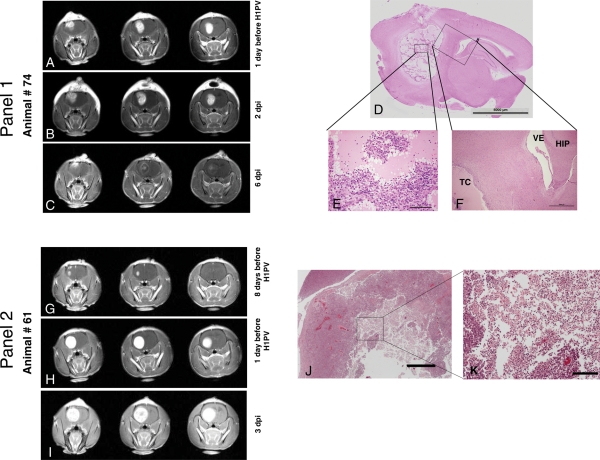
Fig. 3.
Analyses of oncolytic effects in gliomas after H-1PV infection. Panel 1: Regressing tumor (A–C): Tumor regression by MRI (different time points relative to H-1PV infection, 3 coronary sections shown for each examination date). (A) One day before H-1PV administration (15 days after tumor cell implantation), a large tumor was visible in the right frontal lobe. (B) Two days after stereotactic injection of H-1PV, the area of contrast enhancement had slightly increased in volume but displayed a more inhomogeneous appearance (which was associated with an improvement in clinical symptoms). (C) On day 6 p.i., the tumor showed a massive reduction in contrast uptake and an entirely different staining pattern, with a rim-like appearance and only a few areas of remaining enhancement in the central and the most superficial parts of the tumor. The animal was without any clinical symptoms of cerebral or other origin and was sacrificed on this day for further analysis. (D–F) Histological analysis of the area of H-1PV-induced glioma destruction in above animal. (D) In this sagittal section of the entire right hemisphere of the brain (H&E staining; scale bar 5 mm), a large cavity was visible in the location of the initial tumor, whereas surrounding and distant brain tissue had a normal appearance. (E) At a higher (×20) magnification, the tumor cavity appeared to be composed of islands of remaining vital tumor cells embedded in an amorphous eosinophilic mass. Scattered granulocytes, erythrocytes, and plasma cells were detectable, in particular at the periphery of the tumor cell islands. (F) A ×4 magnification of the oblique box in D shows part of the tumor cavity (TC) and adjacent normal structures of the brain such as the ventricle (VE) and the hippocampus (HIP). A few tumor cells were visible underneath the ependyma of the ventricular wall. Scattered lymphocytes and plasma cells were present in the immediate vicinity of the tumor cavity. Otherwise, no significant pathological alterations were detectable within the normal tissue adjacent to the tumor. Panel 2: Progressing tumor in spite of H-1PV therapy (G–I): MR analysis. (G) Eight days before H-1PV administration (10 days after tumor cell implantation), a small tumor began to develop in the right frontal lobe. (H) One day before treatment with H-1PV, the tumor occupied almost the entire right frontal lobe, demonstrating the rapid growth of the glioma. (I) On day 3 p.i., the tumor had further increased in volume. The animal had become symptomatic and was sacrificed on this day. Of note, the uptake of the contrast agent (gadolinium) was less homogeneous in central areas of the tumor injected with H-1PV (I, middle image) compared with the previous time point (H), similar to early changes in regressing tumor (panel 1, B and C). (J and K) Histological analysis. (J) At a low magnification (×2, scale bar 1000 µm), histological appearance of the tumor (H&E staining) showed pale staining of necrotic tissue in the center. (K) At a higher magnification (×10, scale bar 200 µm), oncolysis was characterized by numerous cells with shrunken nuclei (similar to image E, panel 1) as well as necrotic/autolytic ghost cells indicating lytic activity of H-1PV.

