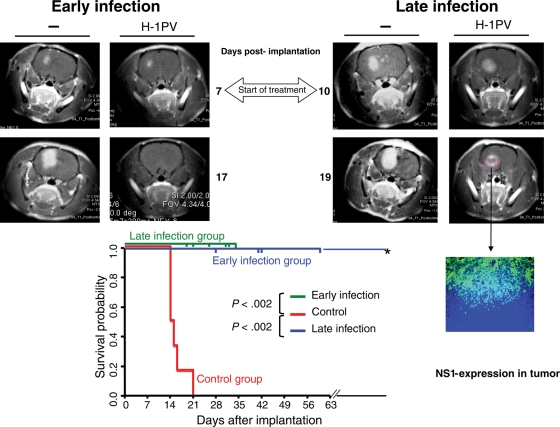
Fig. 5.
H-1PV-induced suppression of human gliomas (established from U87 cells) in RNU rats. (Upper panel) Demonstration of tumor regression by MRI (4 representative rat brains; images at different time points relative to tumor cell implantation [105 U87 cells per animal], as indicated). (Left MRI) At day 7 after tumor cell implantation, a small tumor was visible in the right frontal lobe of the 2 brains shown. “Early infection” (combined ic and iv infection with H-1PV) was performed at this day. After 10 days (day 17 post-implantation), this tumor had disappeared in the treated animal (“H-1PV”), whereas in the control animal (–) the tumor area had largely increased. (Right MRI) At day 10 after implantation of U87 cells, a relatively large tumor was identified by MRI in both animals' brains. At this day, “late infection” was performed as described above for “early infection”. In the treated animal, the tumor stopped growing after ic + iv treatment with H-1PV as demonstrated 9 days p.i. (day 19 post-implantation), in contrast to the continuing development of the tumor in the untreated animal (–). Immunohistological examination of the growth-arrested tumor (cryosection of the treated animal's brain) showed expression of the parvoviral NS-1 protein in the necrotic tumor area. (Lower panel) Significantly improved survival of H-1PV-treated animals compared with controls. Early and late infections refer to the time of virus administration relative to tumor development, corresponding to the treatment of small and large tumors, respectively (see main text). All untreated animals had to be sacrificed because of tumor progression, at the latest on day 21 after tumor cell implantation. All treated animals were killed at various times p.i. for analyses of tumors size and histology. All but one of the treated animals, killed on day 19, survived longer than the controls and were sacrificed for analyses on days indicated separately for early and late infection by vertical bars on the two 100% survival probability lines (horizontal lines at 1.0) representing the survival of the 2 treatment groups. One animal (*) survived for more than 8 months.

