Fig. 3.
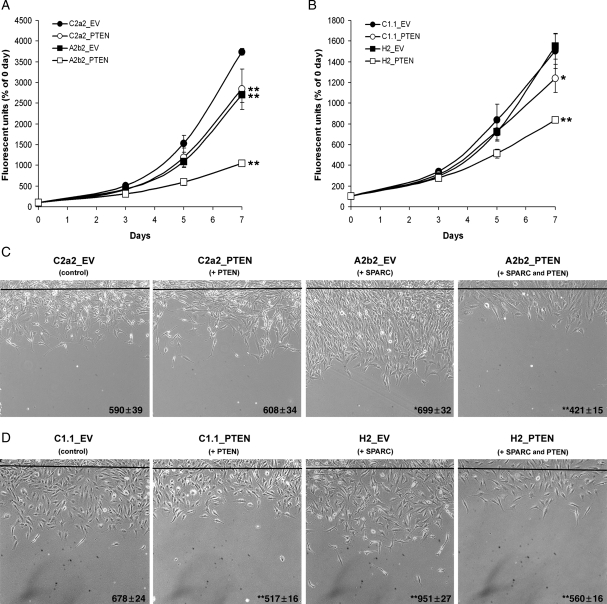
PTEN decreases proliferation and migration in SPARC-expressing and control U87MG-transfected cell lines. (A,B) Cells were plated on fibronectin and analyzed at 0, 3, 5, and 7 day timepoints for dsDNA content using a fluorescent assay. The assay was repeated 3 times and analyzed statistically. Asterisks denote significantly different from C2a2_EV or C1.1_EV where * = P < 0.01, ** = P < 0.001. (C,D) Equal numbers of cells were plated on fibronectin and wounded. The black line represents the beginning of the wound. The distance migrated past the wounding line was measured after 20 h using random microscopic fields from 4 wounds/cell type. The assay was repeated twice and analyzed statistically. The numbers represent the distance in µm ± the SEM. Asterisks denote significantly different from C2a2_EV or C1.1_EV where * = P < 0.05, ** = P < 0.001.

