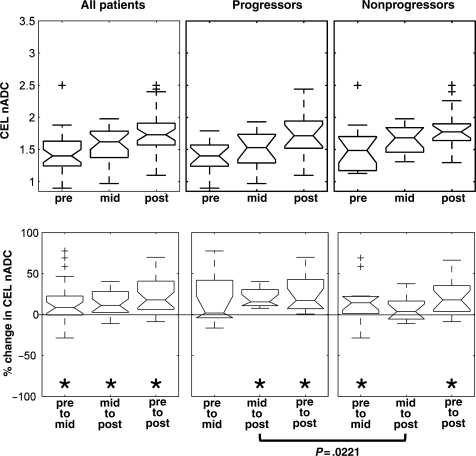
Fig. 3.
A trend of increasing CEL nADC values was observed over time. A trend toward significantly different percent change from mid- to post-RT scans was observed between progressors and nonprogressors (P-values presented are based on the 2-sided Mann–Whitney rank-sum test). Changes between 2 time points within each patient group were tested using the Wilcoxon signed-rank test; statistically significant (P<0.05) changes were noted with an asterisk; + sign represents the box plot outliers.

