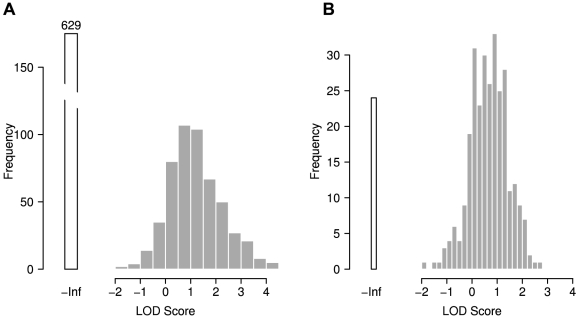
Figure 2. Disease mutations are overrepresented in correlated positions.
Distribution of log odds (LOD) scores for individual proteins. All proteins for which no score could be obtained were excluded. A: All proteins; B: proteins with  disease mutations. The bars at -Inf represent cases where no position was both correlated and associated with disease, resulting in an LOD of
  , as discussed in the main text.

