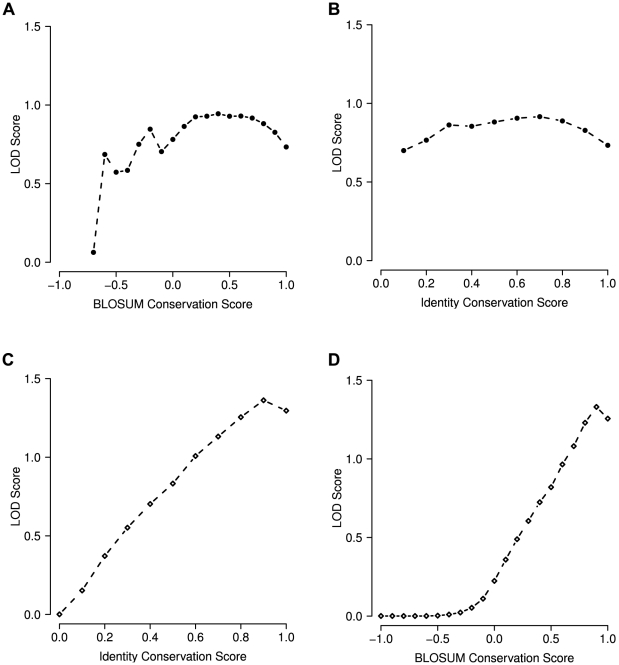
Figure 3. Interdependence between correlation and sequence conservation.
LOD distribution for different conservation thresholds: (A, B) LOD for correlated residues at different levels of conservation. (A) BLOSUM conservation score, (B) fractional identity. Each dot represents the LOD score achieved using a specific conservation cutoff. A cutoff of 0.4 indicates that for the calculation of the global LOD score only the residues which have a conservation score  were taken into account. (C, D) LOD scores for sequence conservation irrespective of residue correlation. Here, a cutoff of 0.4 indicates that the global LOD represents all positions with a conservation score
  . The LOD remains largely stable over wide ranges of sequence conservation (A,B). Residue conservation yields LODs similar to correlation for intermediate levels of conservation and performs better for very high conservation.

