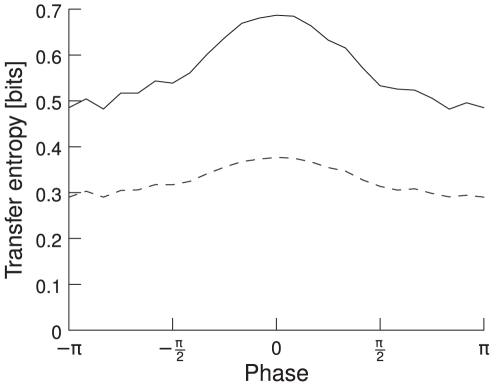
Figure 7. TE as a function of phase shifts and directionality.
The phases are aligned relative to the mean phase, i.e., a phase shift of zero represents mean phase shift. TE is highest for the mean phase shift and gets lower the more it differs from it. The solid line represents TE from neuronal pool 1 to pool 2 (forward), the dashed line from pool 2 to pool 1 (backward). Forward TE is clearly stronger than backward TE.  /
/
 , averaged over 100 trials.

