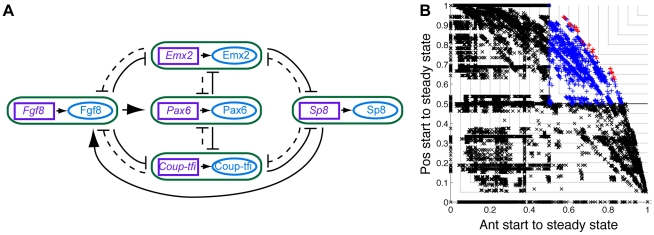
Figure 8. A selection of networks that produced the correct average expression gradients and have common structural elements.
(A) The structure of the networks. The purple boxes with names in italics represent genes and the blue ellipses with names in upright text represent proteins. Each of the gene
 protein interactions has been condensed into a green box to simplify the diagram and avoid intersecting edges. Each edge between the rounded green boxes indicates how the protein in the source box regulates the gene in the target box. The solid lines indicate interactions that must be present while the dashed lines indicate interactions that can be present or absent. The
  dashed interactions means that this diagram represents
  different networks. (B) The performance of these 64 networks (red pluses) on a plot of probability of following the desired anterior state trajectory against the probability of following the desired posterior state trajectory. All other good networks are marked with blue pluses, all bad networks with black crosses.

