
Figure 6. Results of SFA, PCA, SFAm, and admixture applied to simulated genotype data from a single 2-D habitat.
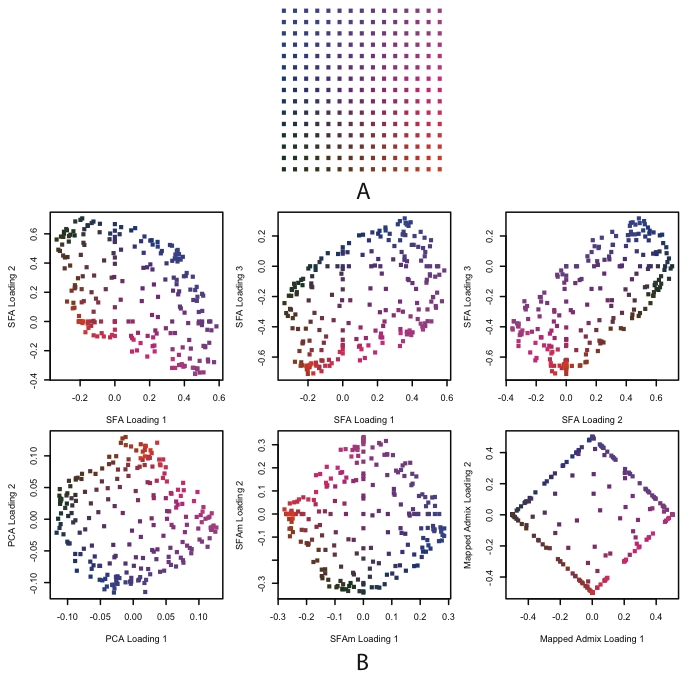
In Panel A, each dot represents a population colored according to location. In Panel B, each plot is of the loadings across individuals against each other, where the colors correspond to their locations in Panel A. The first row shows the three SFA loadings against each other from a three factor model. The second row shows the second two PCA loadings, the SFAm loadings, and the mapped admixture loadings (see text for details). All of the methods recapitulate, to a greater or lesser extent, the geographical structure of the habitats (up to rotation).